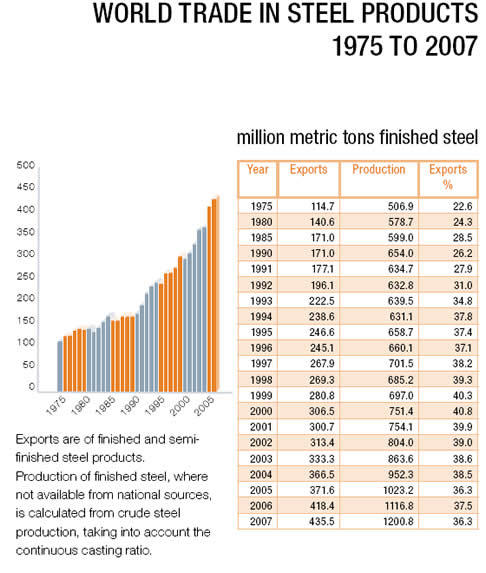
statistical data
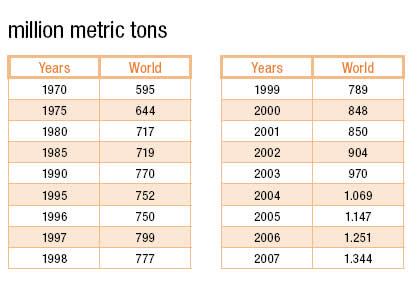
World Steel Production analysis form 1970-2007
Following chart showing steel growth rate in world.
Major Steel Producing Countries, 2005 - 2006
Million Metric Tons Crude Steel Production
| Country |
2006 |
2005 |
| Rank |
Tonnage |
Rank |
Tonnage |
| China |
1 |
422.7 |
1 |
355.8 |
| Japan |
2 |
116.2 |
2 |
112.5 |
| United States |
3 |
98.6 |
3 |
94.9 |
| Russia |
4 |
70.8 |
4 |
66.1 |
| South Korea |
5 |
48.5 |
5 |
47.8 |
| Germany |
6 |
47.2 |
6 |
44.5 |
| India |
7 |
44 |
7 |
40.9 |
| Ukraine |
8 |
40.9 |
8 |
38.6 |
| Italy |
9 |
31.6 |
10 |
29.3 |
| Brazil |
10 |
30.9 |
9 |
31.6 |
| Turkey |
11 |
23.3 |
11 |
21 |
| Taiwan, China |
12 |
20.2 |
13 |
18.9 |
| France |
13 |
19.9 |
12 |
19.5 |
| Spain |
14 |
18.4 |
14 |
17.8 |
| Mexico |
15 |
16.3 |
15 |
16.2 |
| Canada |
16 |
15.4 |
16 |
15.3 |
| United Kingdom |
17 |
13.9 |
17 |
13.2 |
| Belgium |
18 |
11.6 |
18 |
10.4 |
| Poland |
19 |
10 |
21 |
8.3 |
| Iran |
20 |
9.8 |
20 |
9.4 |
| South Africa |
21 |
9.7 |
19 |
9.5 |
| Australia |
22 |
7.9 |
22 |
7.8 |
| Austria |
23 |
7.1 |
23 |
7 |
| Czech Republic |
24 |
6.9 |
26 |
6.2 |
| Netherlands |
25 |
6.4 |
24 |
6.9 |
| Romania |
26 |
6.3 |
25 |
6.3 |
| Egypt (e) |
27 |
6 |
28 |
5.6 |
| Argentina |
28 |
5.5 |
29 |
5.4 |
| Sweden |
29 |
5.5 |
27 |
5.7 |
| Malaysia |
30 |
5.5 |
30 |
5.3 |
| Thailand |
31 |
5.4 |
31 |
5.2 |
| Slovakia |
32 |
5.1 |
34 |
4.5 |
| Finland |
33 |
5.1 |
33 |
4.7 |
| Venezuela |
34 |
4.9 |
32 |
4.9 |
| Kazakhstan |
35 |
4.2 |
35 |
4.5 |
| Saudi Arabia |
36 |
4 |
36 |
4.2 |
| Indonesia |
37 |
3.8 |
37 |
3.7 |
| Luxembourg |
38 |
2.8 |
39 |
2.2 |
| Greece |
39 |
2.4 |
38 |
2.3 |
| Byelorussia |
40 |
2.3 |
40 |
2 |
| Bulgaria |
41 |
2.1 |
41 |
2 |
| Hungary |
42 |
2.1 |
42 |
2 |
| Others |
|
1013.2 |
|
1141.9 |
| World |
|
1,244.18 |
|
1,141.86 |
Source: International Iron
and Steel Institute ( IISI )
Archive:
Major Steel Producing Countries
2000-2001,
2001-2002,
2002-2003,
2003-2004,
2004-2005,
2005-2006
Major Steel Producing Companies, 2005 - 2006
The table below shows the top 80 steel producing companies in 2007. mmt
refers to million metric tons of crude steel output.
| 2007 |
2006 |
|
2007 |
2006 |
|
| Rank |
mmt |
Rank |
mmt |
Company |
Rank |
mmt |
Rank |
mmt |
Company |
| 1 |
116.4 |
1 |
117.2 |
ArcelorMittal |
41 |
7.3 |
36 |
7.4 |
Salzgitter3 |
| 2 |
35.7 |
2 |
34.7 |
Nippon Steel |
42 |
7.0 |
40 |
7.0 |
Ilyich |
| 3 |
34.0 |
3 |
32.0 |
JFE |
43 |
6.9 |
44 |
6.5 |
voestalpine |
| 4 |
31.1 |
4 |
30.1 |
POSCO |
44 |
6.8 |
41 |
6.8 |
BlueScope |
| 5 |
28.6 |
6 |
22.5 |
Baosteel |
45 |
6.6 |
42 |
6.8 |
Panzhihua |
| 6 |
26.5 |
45 |
6.4 |
Tata Steel1 |
46 |
6.4 |
46 |
6.3 |
Metalloinvest |
| 7 |
23.6 |
5 |
22.6 |
Anshan-Benxi |
47 |
6.4 |
53 |
5.2 |
Beitei |
| 8 |
22.9 |
17 |
14.6 |
Jiangsu Shagang |
48 |
6.3 |
49 |
6.0 |
Azovstal |
| 9 |
22.8 |
9 |
19.1 |
Tangshan |
49 |
6.2 |
38 |
7.2 |
Duferco |
| 10 |
21.5 |
7 |
21.2 |
US Steel |
50 |
6.2 |
73 |
3.6 |
Rizhao Steel |
| 11 |
20.2 |
16 |
15.1 |
Wuhan |
51 |
6.1 |
71 |
3.7 |
SSAB |
| 12 |
20.0 |
8 |
20.3 |
Nucor |
52 |
6.1 |
50 |
6.0 |
Mechel |
| 13 |
18.6 |
15 |
15.6 |
Gerdau Group |
53 |
6.0 |
57 |
4.9 |
Nanjing |
| 14 |
17.9 |
11 |
18.2 |
Riva |
54 |
5.9 |
51 |
5.7 |
AK Steel |
| 15 |
17.3 |
12 |
17.5 |
Severstal |
55 |
5.8 |
52 |
5.4 |
Guangxi Liuzhou |
| 16 |
17.0 |
13 |
16.8 |
ThyssenKrupp2 |
56 |
5.6 |
55 |
5.1 |
Jiangxi Xinyu |
| 17 |
16.2 |
14 |
16.1 |
Evraz |
57 |
5.5 |
59 |
4.8 |
HKM4 |
| 18 |
14.2 |
23 |
10.9 |
Maanshan |
58 |
5.4 |
56 |
5.0 |
Erdemir |
| 19 |
13.9 |
19 |
13.5 |
SAIL |
59 |
5.3 |
74 |
3.5 |
CSN |
| 20 |
13.8 |
18 |
13.6 |
Sumitomo |
60 |
5.2 |
54 |
5.2 |
Tangshan Guofeng |
| 21 |
13.3 |
21 |
12.5 |
Magnitogorsk |
61 |
5.0 |
61 |
4.4 |
Tonghua |
| 22 |
13.1 |
20 |
12.8 |
Techint |
62 |
5.0 |
63 |
4.3 |
Steel Dynamics |
| 23 |
12.9 |
26 |
10.5 |
Shougang |
63 |
4.6 |
67 |
4.0 |
HADEED |
| 24 |
12.1 |
22 |
11.2 |
Jinan |
64 |
4.6 |
62 |
4.4 |
Zaporizhstahl |
| 25 |
11.7 |
24 |
10.8 |
Laiwu |
65 |
4.5 |
60 |
4.5 |
EZDK |
| 26 |
11.1 |
27 |
9.9 |
Hunan Valin |
66 |
4.4 |
64 |
4.3 |
Shaoguan |
| 27 |
10.9 |
25 |
10.7 |
China Steel |
67 |
4.4 |
65 |
4.2 |
Global Steel Holdings |
| 28 |
10.1 |
28 |
9.8 |
IMIDRO |
68 |
4.4 |
75 |
3.5 |
Tianjin Tiantie |
| 29 |
10.0 |
30 |
8.9 |
Hyundai |
69 |
4.1 |
66 |
4.0 |
Pingxiang |
| 30 |
9.7 |
29 |
9.1 |
Novolipetsk |
70 |
4.1 |
87 |
3.0 |
Tianjin Steel |
| 31 |
9.3 |
47 |
6.3 |
Taiyuan |
71 |
4.1 |
69 |
3.8 |
Nisshin |
| 32 |
9.1 |
32 |
8.7 |
Metinvest Holdings |
72 |
4.0 |
68 |
3.9 |
Hebei Jinxi |
| 33 |
9.0 |
39 |
7.0 |
Anyang |
73 |
4.0 |
77 |
3.4 |
Lion Group |
| 34 |
8.8 |
35 |
7.5 |
Baotou |
74 |
3.6 |
92 |
2.8 |
Essar Steel |
| 35 |
8.7 |
31 |
8.8 |
Sistema Usiminas |
75 |
3.5 |
78 |
3.4 |
AHMSA |
| 36 |
8.3 |
33 |
7.9 |
Handan |
76 |
3.5 |
79 |
3.3 |
Guangzhou |
| 37 |
8.1 |
37 |
7.2 |
Celsa |
77 |
3.5 |
85 |
3.2 |
Chongqing |
| 38 |
8.1 |
34 |
7.7 |
Kobe Steel |
78 |
3.5 |
80 |
3.3 |
Hangzhou |
| 39 |
7.6 |
48 |
6.0 |
Tangshan Jianlong |
79 |
3.5 |
83 |
3.2 |
Tokyo Steel |
| 40 |
7.4 |
43 |
6.6 |
Jiuquan |
80 |
3.4 |
70 |
3.8 |
Stelco |
(1) - 2007 figure includes Corus
(2) - 50% of HKM included in ThyssenKrupp
(3) - includes part of HKM
(4) - total production
|


